Key Concepts Breakdown of Scope Models Copy
Here are some of the key concepts and common questions I get about Scope Models:
When to use a scope/context model?
Scope models are typically done towards the beginning of a project or the beginning of feature/enhancement/defect work. Though, if one hasn’t been created, I have used them as a start to testing to make sure I understand what the scope is and user actions that need to be tested. So, using them at anytime will provide value to the team and the results! Especially when there seems to be a lack of clarity on what the scope is for a project.
You also have some unique accountability in scope and changing requirements. Take a look at this article that explains more.
The model evolves, it’s not a one and done
This model is not a one and done model…though it’s commonly created at the beginning of an effort, it likely will evolve and change over time. It’s meant to be a discussion piece, not a model to be approved or signed off on. It helps the team create structured dialog and meaningful dialog. So, make sure to use it frequently to guide conversations, guide analysis, and don’t be afraid to update it as needed! If you are concerned about it not being signed off or formally approved by your business stakeholders, try to think about scope changes as a negotiation. By this, I mean that once we determine with this diagram what is in scope, you can use it to help the business make trade-off decisions on scope. For example, If something comes up that was not discussed previously, then you can use the diagram to ask the business decision maker about where it fits in. You can also bring the project manager into a critical dialog about removing scope to fit it in the change, or how priorities, resources or timelines may need to shift.
System vs. business & user point of view
When starting to use this diagram, many are tempted to add a lot of technical pieces. This isn’t a technical architecture map! It is supposed to be user and business focused with only conceptual technical concepts. Save the technical things for another version of the diagram, it’s okay to make a technical version of it, keep the technical and business/user version separate. You risk the engagement dropping from your user and business group if this diagram is full of technical details. It should be focussed on the user interactions and the data flow that supports user actions.
Getting the level of detail right
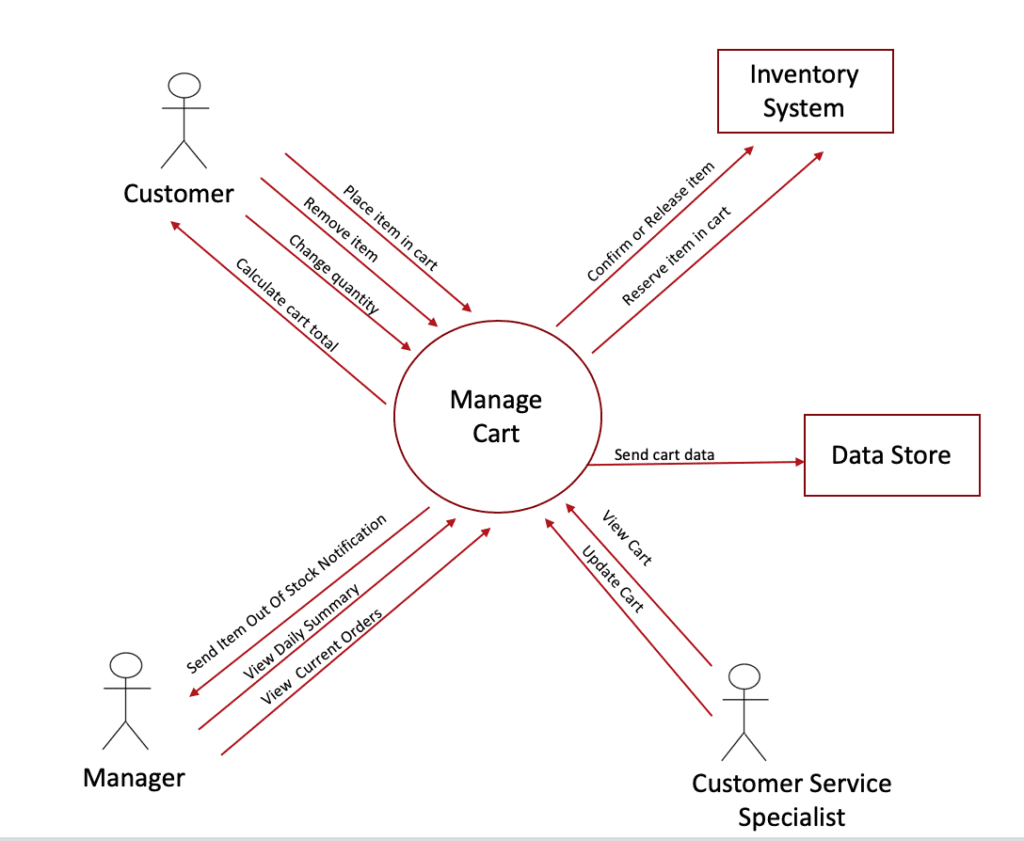
It can be really hard to get the level of detail on point with this diagram. The idea here is to make it consumable for your audience. And there is some neuroscience to back this up. Visual Models are made up of nodes and connectors. And, the number of nodes and connectors that the human brain can digest is what we are looking to optimize here and in any model. Too few, and the model becomes lacking of meaning, too many and it’s just too hard to follow. For this one, you want to ideally focus in on 3-4 human actors, 2-4 boxes, and 10-15 arrows. Let’s look at some examples to guide you in the level of detail.
Ok, here is our “Cart” diagram, from the previous video:
Now, here is what this would look like if we did something with too little to be meaningful:
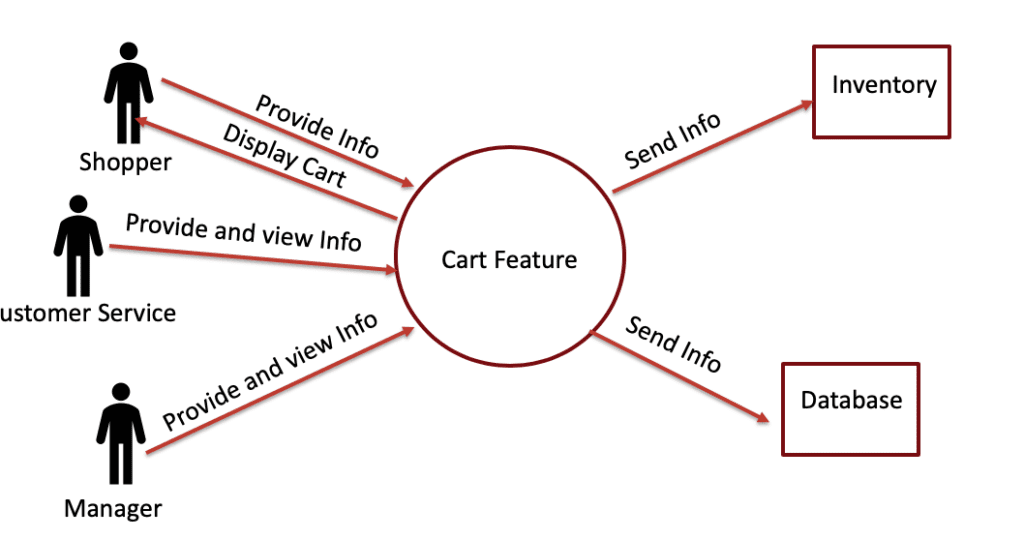
Can you see how this diagram has little meaning and wouldn’t inspire much dialog? It has too little information for much conversation to spark. And, if we had too much information it would have so many arrows and pieces that it would be hard to read. You want to aim for 10-15 arrows total for readability.
So, how do we fix these challenges when you encounter them?
If you don’t have enough information and detail, you likely need to widen your context and take a step back to understand the user context more. You could be looking at too narrow of a scope to make the diagram valuable. You also may be lacking in detail, the detail that matters, like the diagram above. Look at your verbs and nouns and make them more specific.
If you have too much information, try scaling back the diagram, and adding a bullet list of users/goals to go with the diagram. So, the bullet point list for the cart diagram might look like this in order to keep the diagram easy to read and work with. This bullet list might be a page that accompanies the diagram. It would be too much detail for the diagram itself.
Customer:
- Place Item in cart
- View cart contents
- Remove item from cart
- Remove multiple items from cart
- Change item quantity
- Apply a coupon code
- View cart totals
- Calculate cart total
- Items total cost
- Shipping total
- Promo/coupons total
- Tax total
- Recalculate total upon item change
Manager:
- View Current Orders
- View details by stage
- View aging of orders
- View orders of VIPs
- View Daily Summary
- View detail on product segments
- View details on coupon performance
- View details on sales by region
- View details on sales per hour
- Notifications to Manager
- Item out of stock
- Item low stock
- Volume higher than capacity
- Volume lower than capacity
Customer Service Rep:
- View Cart
- View items
- View Item Detail
- View Promos
- View Customer History
- Update Cart
- Apply promo code
- Remove item
- Add item
- Change item quantity
- Change customer address
- Apply a $ amount discount
- Check inventory
Modeling Interactions not Processes
It can be tempting to connect actors to other actors and to the boxes (other systems and entities). It’s key to remember that this is an interaction model, not a process/sequence model. So, the focus is in the various interactions the users have with the system or solution and not on the sequence of the various interactions.
Model the whole solution or a feature
Like our “cart” diagram, you can model just a feature. You can also model an entire solution or product as well. I recommend using both, depending on the level of detail you are working at. Once you get the hang of it, these are pretty quick to create, so just draw it out! I like to draw my first draft with a pencil on a blank sheet of paper, and then once I get that chance to think with my own thoughts and sketch it out, I can decide if I use it with a group and what level of detail, depends on the purpose of the meeting and group process.
Wait, “Manage” is a mushy word, and used in the diagram!
Ah, yes….the “cart” diagram we have been using has a mushy word in the middle “Manage Cart”. While “manage” is mushy, it is the over arching word to describe an entire set of user actions, so we can get by with it since it is being broken down into non-mushy words.
Can I use this diagram in Agile?
Of course, I love using this diagram with agile teams. The Actors and their verb noun labels, align really well to Epics! It’s like magic!
Can I use this for Package/Vendor/Cloud software?
Yes, I would highly recommend that you create a scope model for any package software as well as sub-models for each major function/module that the package software has!
Know who your target actor is
With these diagrams and any project, it can help to identify who the target actor is. That is, who is the user role or group who is the main user or main focus of the solution or project? This can help the team focus first on this actor role and their needs, then look to the secondary actors whose actions typically support the target or main actor. For example, in the cart example, the target actor would be a shopper, and supporting actors are the store management, and customer service.
Next, let’s put this to work and practice these concepts on a Scope Model!