Let’s Practice Some Decision Table Concepts Copy
Before we dig into some full examples of turning requirements logic statements into decision tables, let’s practice some concepts to help prepare.
1. Determine the Decision To Be Made (the Result column, the last column of the table)
In the following set of requirements details, what is the decision to be made?
- When users submit their shipping address the system needs to first ensure that the address can be submitted to the validation service to validate the address as an accurate and shippable address. A submittable address in the United States must contain a street number, street, and 5 digit zip code in order to be submitted to a software to match to a shippable address. If the user submits a city and state, a zip code can be autogenerated by the software. Once the required fields are submitted the software will confirm that the address is a shippable address.
-
- Is the address valid?
- Is the address entered fit to submit for validation?
- Is the address shippable?
- Is the address in the United States?
In this example, the best answer is, “Is the address entered fit to submit for validation?” This is what the last column title of the Decision Table would be.
2. Determine the conditions that are inputs to the Result
In this same example, identify the conditions that we need to evaluate as input to the decision/result:
Take a moment to think about and write down what the conditions are….
Okay, did you come up with the following conditions?
- A street number is entered
- A street is entered
- A 5 digit zip code is entered
- A city is entered
- A state is entered
These become the column headers of the decision table, it would look like this for the first header row of the table:

3. Complete the Decision Table frame
Now that we know how many conditions, we can determine how many rows there should be. When each condition is a Yes/No condition, it makes for an easy way to logically determine the row count. Without a Yes/No condition the row count becomes very difficult to manage. With the Yes/No condition defined, there are 2 options for each condition; it’s either yes or no. The simple calculation with the Yes/No conditions it the number of conditions as the exponent of 2. Then the exponent (or power) is the number of conditions (the table above has 5). With this example, the number or rows or scenarios is calculated with the calculation of 2 to the power of 5, or 2x2x2x2x2, and this math equals 32. This table will have 32 rows or 32 potential scenarios that the team needs to code and test for to get the functionality right.
Your Turn!
How many rows or scenarios would there be with 3 conditions (each conditioned defined as a yes/no option)?
And, 4 conditions?
And, how about 6?
If you got:
- 3 conditions equals 8 rows/scenarios (2x2x2 = 8)
- 4 conditions equals 16 rows/scenarios (2x2x2x2 = 16)
- 6 conditions equals 64 rows/scenarios (2x2x2x2x2x2 = 64)
You got it!
Now, imagine reviewing 64 possible scenarios (or lots more) with the business owner or SME (Subject Matter Expert)! That is a lot! So, we try to keep these small, 3 conditions is ideal. Many tables of 8 scenarios (3 conditions), is easier to review and understand compared to a single table with 100s or 1000s of rows. Decomposing the logic into smaller pieces of logic might be needed as well we abstracting detailed pieces into larger pieces. For example: A condition of requiring a street number may be broken down into further detailed conditions like: numeric only, no dashes, and between 1 and 6 digits to be an acceptable street number. These 3 conditions could be a separate decision table with the results of “acceptable street number”, and “acceptable street number” becomes a condition of a higher level decision table about a submittable address.
4. Fill in the various combinations of Yes/No for each row
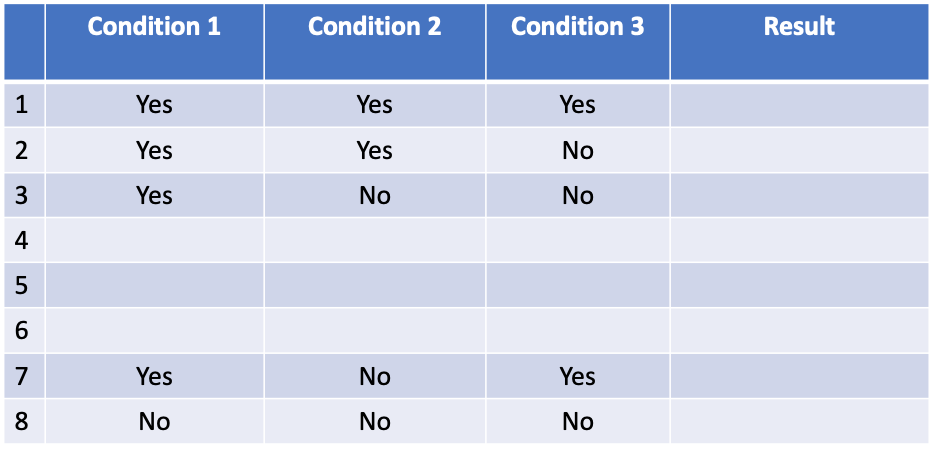
For this table set up with 3 conditions, and 8 rows of scenarios, the inside combinations will be the same as every other 3 condition decision table. The results will be different, but the Yes/No combinations remain constant for every table.
Complete the missing Yes/No combinations in this table:
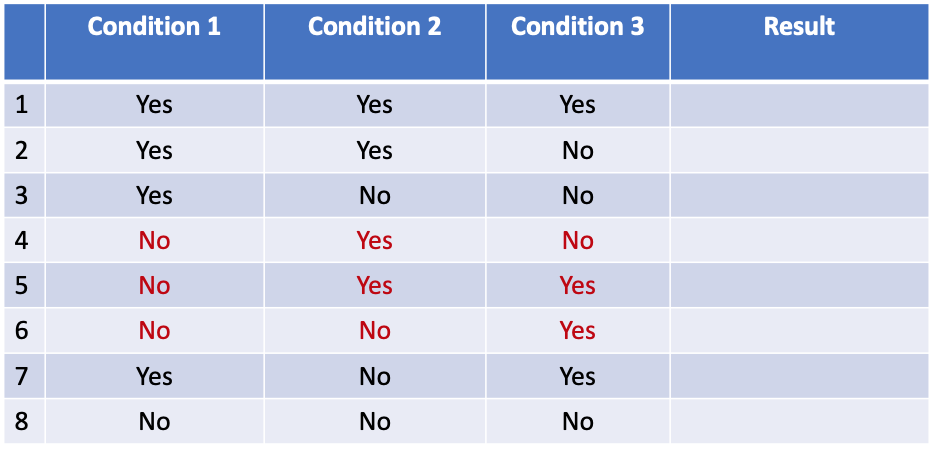
Did you get these 3 rows and combinations?
5. Review with Stakeholders
Congrats! You now have the analysis steps done of:
- Result defined (column header)
- Conditions defined (column header)
- Combinations of scenarios drawn out (table insides)
Next, review the table with your stakeholders and have them help you complete the RESULTS column. Once you and your business/customer stakeholders have the results column done and feel good about it, then review with the development and testing team.
You still need more practice, the next section is a few examples for you to work through with less guidance.